|
|
| L0.77 | |
| tc = 0.0078 | |
| S0.385 |
| L0.6 n0.6 | |
| tc = 0.0078 | |
| S0.385 |
| L | |
| tc = 21.3 | |
| 5280 A0.1 S0.2 |
| 1.8 (1.1 - C) L0.5 | |
| tc = | |
| S0.33 |
Where:
C = the dimensionless runoff coefficient
L = the distance traveled, in feet, and
S = the slope, in percent
| Very smooth asphalt: | 0.007 |
| Tar and sand pavement: | 0.0075 |
| Concrete: | 0.012 |
| Tar and gravel pavement: | 0.017 |
| Closely clipped sod: | 0.046 |
| Dense bluegrass: | 0.060 |
| Downtown Business: | 0.70 - 0.95 |
| Single Family Res: | 0.30 - 0.50 |
| Asphalt/Concrete: | 0.70 - 0.95 |
| Sandy Soil Lawn: | 0.05 - 0.20 |
| Heavy Soil Lawn: | 0.13 - 0.35 |
| Brick: | 0.70 - 0.85 |
| Smooth Pavement: | 0.02 |
| Poor grass, bare sod: | 0.30 |
| Average grass: | 0.40 |
| Dense grass: | 0.80 |
| Concrete: | 0.011 |
| Bare sand: | 0.010 |
| Natural range: | 0.080 |
| Bluegrass sod: | 0.450 |
| Short prairie: | 0.150 |
| Woods: | 0.450 |
| RUNOFF COEFFICIENTS FOR THE RATIONAL FORMULA FOR HYDROLOGIC SOIL GROUP AND SLOPE RANGE | ||||||||||||
|---|---|---|---|---|---|---|---|---|---|---|---|---|
| A | B | C | D | |||||||||
| Land Use | 0-2% | 2-6% | 6%+ | 0-2% | 2-6% | 6%+ | 0-2% | 2-6% | 6%+ | 0-2% | 2-6% | 6%+ |
| Cultivated Land | 0.08 | 0.13 | 0.16 | 0.11 | 0.15 | 0.21 | 0.14 | 0.19 | 0.26 | 0.18 | 0.23 | 0.31 |
| 0.14 | 0.18 | 0.22 | 0.16 | 0.21 | 0.28 | 0.20 | 0.25 | 0.34 | 0.24 | 0.29 | 0.41 | |
| Pasture | 0.12 | 0.20 | 0.30 | 0.18 | 0.28 | 0.37 | 0.24 | 0.34 | 0.44 | 0.30 | 0.40 | 0.50 |
| 0.15 | 0.25 | 0.37 | 0.23 | 0.34 | 0.45 | 0.30 | 0.42 | 0.52 | 0.37 | 0.50 | 0.62 | |
| Meadow | 0.10 | 0.16 | 0.25 | 0.14 | 0.22 | 0.30 | 0.20 | 0.28 | 0.36 | 0.24 | 0.30 | 0.40 |
| 0.14 | 0.22 | 0.30 | 0.20 | 0.28 | 0.37 | 0.26 | 0.35 | 0.44 | 0.30 | 0.40 | 0.50 | |
| Forest | 0.05 | 0.08 | 0.11 | 0.08 | 0.11 | 0.14 | 0.10 | 0.13 | 0.16 | 0.12 | 0.16 | 0.20 |
| 0.08 | 0.11 | 0.14 | 0.10 | 0.14 | 0.18 | 0.12 | 0.16 | 0.20 | 0.15 | 0.20 | 0.25 | |
| Residential | 0.25 | 0.28 | 0.31 | 0.27 | 0.30 | 0.35 | 0.30 | 0.33 | 0.38 | 0.33 | 0.36 | 0.42 |
| Lot Size 1/8 acre | 0.33 | 0.37 | 0.40 | 0.35 | 0.39 | 0.44 | 0.38 | 0.42 | 0.49 | 0.41 | 0.45 | 0.54 |
| Lot Size 1/4 acre | 0.22 | 0.26 | 0.29 | 0.24 | 0.29 | 0.33 | 0.27 | 0.31 | 0.36 | 0.30 | 0.34 | 0.40 |
| 0.30 | 0.34 | 0.37 | 0.33 | 0.37 | 0.42 | 0.36 | 0.40 | 0.47 | 0.38 | 0.42 | 0.52 | |
| Lot Size 1/3 acre | 0.19 | 0.23 | 0.26 | 0.22 | 0.26 | 0.30 | 0.25 | 0.29 | 0.34 | 0.28 | 0.32 | 0.39 |
| 0.28 | 0.32 | 0.35 | 0.30 | 0.35 | 0.39 | 0.33 | 0.38 | 0.45 | 0.36 | 0.40 | 0.50 | |
| Lot Size 1/2 acre | 0.16 | 0.20 | 0.24 | 0.19 | 0.23 | 0.28 | 0.22 | 0.27 | 0.32 | 0.26 | 0.30 | 0.37 |
| 0.25 | 0.29 | 0.32 | 0.28 | 0.32 | 0.36 | 0.31 | 0.35 | 0.42 | 0.34 | 0.38 | 0.48 | |
| Lot Size 1 acre | 0.14 | 0.19 | 0.22 | 0.17 | 0.21 | 0.26 | 0.20 | 0.25 | 0.31 | 0.24 | 0.29 | 0.35 |
| 0.22 | 0.26 | 0.29 | 0.24 | 0.28 | 0.34 | 0.28 | 0.32 | 0.40 | 0.31 | 0.35 | 0.46 | |
| Industrial | 0.67 | 0.68 | 0.68 | 0.68 | 0.68 | 0.69 | 0.68 | 0.69 | 0.69 | 0.69 | 0.69 | 0.70 |
| 0.85 | 0.85 | 0.86 | 0.85 | 0.86 | 0.86 | 0.86 | 0.86 | 0.87 | 0.86 | 0.86 | 0.88 | |
| Commercial | 0.71 | 0.71 | 0.72 | 0.71 | 0.72 | 0.72 | 0.72 | 0.72 | 0.72 | 0.72 | 0.72 | 0.72 |
| 0.88 | 0.88 | 0.89 | 0.89 | 0.89 | 0.89 | 0.89 | 0.89 | 0.90 | 0.89 | 0.89 | 0.90 | |
| Streets | 0.70 | 0.71 | 0.72 | 0.71 | 0.72 | 0.74 | 0.72 | 0.73 | 0.76 | 0.73 | 0.75 | 0.78 |
| 0.76 | 0.77 | 0.79 | 0.80 | 0.82 | 0.84 | 0.84 | 0.85 | 0.89 | 0.89 | 0.91 | 0.95 | |
| Open Space | 0.05 | 0.10 | 0.14 | 0.08 | 0.13 | 0.19 | 0.12 | 0.17 | 0.24 | 0.16 | 0.21 | 0.28 |
| 0.11 | 0.16 | 0.20 | 0.14 | 0.19 | 0.26 | 0.18 | 0.23 | 0.32 | 0.22 | 0.27 | 0.39 | |
| Parking | 0.85 | 0.86 | 0.87 | 0.85 | 0.86 | 0.87 | 0.85 | 0.86 | 0.87 | 0.85 | 0.86 | 0.87 |
| 0.95 | 0.96 | 0.97 | 0.95 | 0.96 | 0.97 | 0.95 | 0.96 | 0.97 | 0.95 | 0.96 | 0.97 | |
| TAKEN FROM: "RECOMMENDED HYDROLOGIC PROCEDURES FOR COMPUTING RUNOFF FROM SMALL WATERSHEDS IN PENNSYLVANIA", 1982, The Pennsylvania State University, Chapter 4, pp 4.18-4.19 | ||||||||||||
| A | Runoff coefficients for storm recurrence intervals less than 25 years | |||||||||||
| B | Runoff coefficients for storm recurrence intervals of 25 years or more | |||||||||||
| County | Rainfall Type | 2-yr | 5-yr | 10-yr | 25-yr | 50-yr | 100-yr | 1-yr |
|---|---|---|---|---|---|---|---|---|
| Adams | III | 5.0 | 6.3 | 7.0 | 8.4 | 9.1 | 10.3 | 4.0 |
| Alcorn | II | 3.9 | 4.8 | 5.6 | 6.5 | 7.0 | 7.7 | 3.3 |
| Amite | III | 4.8 | 6.4 | 7.4 | 8.6 | 9.4 | 10.6 | 4.2 |
| Attala | II | 4.3 | 5.4 | 6.3 | 7.2 | 8.1 | 8.8 | 3.7 |
| Benton | II | 4.0 | 4.9 | 5.7 | 6.6 | 7.2 | 7.8 | 3.4 |
| Bolivar | II | 4.3 | 5.3 | 6.2 | 7.0 | 7.8 | 8.6 | 3.6 |
| Calhoun | II | 4.1 | 5.2 | 5.9 | 6.9 | 7.6 | 8.3 | 3.5 |
| Carroll | II | 4.2 | 5.3 | 6.2 | 7.1 | 7.9 | 8.6 | 3.6 |
| Chickasaw | II | 4.1 | 5.1 | 5.9 | 6.8 | 7.6 | 8.3 | 3.5 |
| Choctaw | II | 4.2 | 5.3 | 6.2 | 7.0 | 7.9 | 8.6 | 3.6 |
| Claiborne | III | 4.6 | 6.0 | 6.9 | 7.8 | 8.8 | 9.6 | 3.9 |
| Clarke | III | 4.7 | 6.0 | 6.9 | 7.9 | 8.9 | 9.8 | 3.9 |
| Clay | II | 4.1 | 5.2 | 6.0 | 6.9 | 7.7 | 8.4 | 3.5 |
| Coahoma | II | 4.2 | 5.2 | 6.0 | 6.9 | 7.7 | 8.4 | 3.5 |
| Copiah | III | 4.6 | 6.0 | 6.9 | 7.9 | 8.8 | 9.7 | 3.9 |
| Covington | III | 4.7 | 6.2 | 7.1 | 8.2 | 9.2 | 10.2 | 4.0 |
| DeSoto | II | 4.1 | 5.0 | 5.8 | 6.7 | 7.2 | 8.1 | 4.0 |
| Forrest | III | 4.9 | 6.5 | 7.7 | 8.8 | 10.0 | 11.2 | 4.2 |
| Franklin | III | 4.8 | 6.3 | 7.0 | 8.3 | 9.0 | 10.1 | 4.0 |
| George | III | 5.4 | 7.3 | 8.5 | 9.7 | 11.1 | 12.3 | 4.4 |
| Greene | III | 4.9 | 6.7 | 7.8 | 8.9 | 10.4 | 11.5 | 4.2 |
| Grenada | II | 4.2 | 5.2 | 6.0 | 6.9 | 7.7 | 8.5 | 3.6 |
| Hancock | III | 5.8 | 7.5 | 8.7 | 10.5 | 11.4 | 12.5 | 4.7 |
| Harrison | III | 5.8 | 7.5 | 8.8 | 10.5 | 11.4 | 12.6 | 4.7 |
| Hinds | III | 4.4 | 5.8 | 6.7 | 7.7 | 8.6 | 9.4 | 3.9 |
| Holmes | II | 4.3 | 5.4 | 6.3 | 7.2 | 8.1 | 8.8 | 3.7 |
| Humphreys | III | 4.4 | 5.4 | 6.4 | 7.3 | 8.2 | 8.8 | 3.7 |
| Issaquena | III | 4.3 | 5.6 | 6.6 | 7.5 | 8.4 | 9.1 | 3.8 |
| Itawamba | II | 3.9 | 5.1 | 5.8 | 6.6 | 7.3 | 8.0 | 3.4 |
| Jackson | III | 5.9 | 7.7 | 9.0 | 10.5 | 11.5 | 13 | 4.7 |
| Jasper | III | 4.6 | 6.0 | 6.8 | 7.9 | 8.8 | 9.7 | 3.9 |
| Jefferson | III | 4.7 | 6.1 | 7.0 | 8.0 | 8.9 | 9.9 | 4.0 |
| Jefferson Davis | III | 4.7 | 6.2 | 7.0 | 8.2 | 9.0 | 10.0 | 4.0 |
| Jones | III | 4.8 | 6.2 | 7.2 | 8.2 | 9.3 | 10.5 | 4.0 |
| Kemper | III | 4.4 | 5.6 | 6.5 | 7.4 | 8.2 | 9.0 | 3.7 |
| Lafayette | II | 4.1 | 5.1 | 5.8 | 6.8 | 7.4 | 8.2 | 3.5 |
| Lamar | III | 4.9 | 6.5 | 7.6 | 8.6 | 9.8 | 11.0 | 4.2 |
| Lauderdale | III | 4.6 | 5.7 | 6.7 | 7.6 | 8.5 | 9.4 | 3.8 |
| Lawrence | III | 4.6 | 6.2 | 7.0 | 8.2 | 9.0 | 10.0 | 4.0 |
| Leake | III | 4.3 | 5.5 | 6.5 | 7.4 | 8.3 | 9.0 | 3.8 |
| Lee | II | 4.0 | 5.0 | 5.8 | 6.7 | 7.4 | 8.1 | 3.4 |
| Leflore | II | 4.3 | 5.3 | 6.2 | 7.1 | 7.9 | 8.6 | 3.6 |
| Lincoln | III | 4.7 | 6.2 | 7.0 | 8.2 | 9.0 | 10.0 | 4.0 |
| Lowndes | II | 4.2 | 5.3 | 6.1 | 7.0 | 7.8 | 8.5 | 3.6 |
| Madison | III | 4.4 | 5.6 | 6.5 | 7.5 | 8.4 | 9.1 | 3.8 |
| Marion | III | 4.8 | 6.4 | 7.4 | 8.8 | 9.6 | 10.8 | 4.2 |
| Marshall | II | 4.0 | 5.0 | 5.7 | 6.7 | 7.2 | 7.9 | 3.4 |
| Monroe | II | 4.1 | 5.1 | 5.9 | 6.8 | 7.5 | 8.3 | 3.5 |
| Montgomery | II | 4.2 | 5.3 | 6.2 | 7.0 | 7.8 | 8.6 | 3.6 |
| Neshoba | III | 4.4 | 5.5 | 6.5 | 7.4 | 8.2 | 9.0 | 3.8 |
| Newton | III | 4.5 | 5.7 | 6.7 | 7.6 | 8.5 | 9.3 | 3.8 |
| Noxubee | II | 4.3 | 5.4 | 6.3 | 7.2 | 8.0 | 8.8 | 3.6 |
| Oktibbeha | II | 4.2 | 5.3 | 6.1 | 7.0 | 7.8 | 8.6 | 3.6 |
| Panola | II | 4.1 | 5.1 | 5.9 | 6.8 | 7.5 | 8.2 | 3.5 |
| Pearl River | III | 5.0 | 7.0 | 8.2 | 9.4 | 10.5 | 11.7 | 4.4 |
| Perry | III | 4.9 | 6.6 | 7.8 | 8.8 | 10.1 | 11.4 | 4.2 |
| Pike | III | 4.8 | 6.4 | 7.4 | 8.5 | 9.5 | 10.6 | 4.2 |
| Pontotoc | II | 4.0 | 5.1 | 5.8 | 6.8 | 7.4 | 8.1 | 3.5 |
| Prentiss | II | 3.9 | 4.9 | 5.6 | 6.6 | 7.3 | 7.8 | 3.3 |
| Quitman | II | 4.2 | 5.2 | 6.0 | 6.9 | 7.6 | 8.3 | 3.5 |
| Rankin | III | 4.4 | 5.8 | 6.7 | 7.7 | 8.6 | 9.4 | 3.9 |
| Scott | III | 4.5 | 5.7 | 6.6 | 7.6 | 8.5 | 9.3 | 3.8 |
| Sharkey | III | 4.4 | 5.5 | 6.5 | 7.4 | 8.3 | 9.0 | 3.8 |
| Simpson | III | 4.5 | 6.0 | 6.9 | 7.8 | 8.8 | 9.7 | 3.9 |
| Smith | III | 4.6 | 5.9 | 6.8 | 7.8 | 8.8 | 9.7 | 3.9 |
| Stone | III | 5.3 | 7.2 | 8.3 | 9.6 | 10.9 | 12.1 | 4.4 |
| Sunflower | II | 4.3 | 5.3 | 6.2 | 7.1 | 7.9 | 8.7 | 3.6 |
| Tallahatchie | II | 4.2 | 5.2 | 6.0 | 6.9 | 7.7 | 8.4 | 3.6 |
| Tate | II | 4.1 | 5.1 | 5.8 | 6.7 | 7.3 | 8.1 | 3.4 |
| Tippah | II | 4.0 | 4.9 | 5.6 | 6.6 | 7.2 | 7.8 | 3.4 |
| Tishomingo | II | 3.9 | 4.8 | 5.6 | 6.5 | 7.0 | 7.7 | 3.3 |
| Tunica | II | 4.1 | 5.1 | 5.9 | 6.8 | 7.4 | 8.2 | 3.5 |
| Union | II | 4.0 | 5.0 | 5.7 | 6.7 | 7.3 | 8.0 | 3.4 |
| Walthall | III | 4.8 | 6.4 | 7.4 | 8.6 | 9.6 | 10.8 | 4.2 |
| Warren | III | 4.5 | 5.8 | 6.7 | 7.7 | 8.6 | 9.3 | 3.9 |
| Washington | III | 4.4 | 5.4 | 6.4 | 7.3 | 8.1 | 8.9 | 3.7 |
| Wayne | III | 4.8 | 6.3 | 7.3 | 8.4 | 9.5 | 10.5 | 4.0 |
| Webster | II | 4.2 | 5.2 | 6.1 | 7.0 | 7.7 | 8.5 | 3.6 |
| Wilkinson | III | 4.9 | 6.5 | 7.4 | 8.7 | 9.5 | 10.8 | 4.2 |
| Winston | II | 4.3 | 5.4 | 6.3 | 7.2 | 8.0 | 8.8 | 3.7 |
| Yalobusha | II | 4.1 | 5.2 | 6.0 | 6.9 | 7.6 | 8.4 | 3.5 |
| Yazoo | III | 4.4 | 5.5 | 6.5 | 7.4 | 8.3 | 9.0 | 3.8 |
| Pipe Size (in.) | Arch Equiv. | Metric Equivalent (mm) | Area (ft�) | Weight (lbs/ft) | Wall Thickness (in.) |
|---|---|---|---|---|---|
| 15 | 18x11 | 375 | 1.2 | 140 | 2¼ |
| 18 | 22x13 | 450 | 1.8 | 180 | 2½ |
| 24 | 29x18 | 600 | 3.1 | 286 | 3 |
| 30 | 36x23 | 750 | 4.9 | 402 | 3½ |
| 36 | 44x27 | 900 | 7.1 | 654 | 4¾ |
| 42 | 51x31 | 1,050 | 9.6 | 810 | 5¼ |
| 48 | 58x36 | 1,200 | 12.6 | 1,010 | 5¾ |
| 54 | 65x40 | 1,350 | 15.9 | 1,208 | 6¼ |
| 60 | 73x45 | 1,500 | 19.6 | 1,475 | 6¾ |
| 72 | 88x54 | 1,800 | 28.3 | 1,810 | 7 |
| Pipe Size (in.) | Round Equiv. | Metric Equivalent (mm) | Area (ft�) | Weight (lbs/ft) | Wall Thickness (in.) |
|---|---|---|---|---|---|
| 18x11 | 15 | 460x280 | 1.1 | 188 | 3 |
| 22x13 | 18 | 560x245 | 1.6 | 233 | 3 1/8 |
| 29x18 | 24 | 725x460 | 2.9 | 325 | 3½ |
| 36x23 | 30 | 920x570 | 4.4 | 392 | 3½ |
| 44x27 | 36 | 1110x675 | 6.5 | 537 | 4 |
| 51x31 | 42 | 1300x795 | 8.7 | 696 | 4½ |
| 58x36 | 48 | 1485x915 | 11.4 | 885 | 5 |
| 65x40 | 54 | 1650x1015 | 14.3 | 1,079 | 5½ |
| 73x45 | 60 | 1855x1145 | 17.7 | 1,333 | 6 |
| 88x54 | 72 | 2235x1370 | 25.6 | 1,856 | 7 |
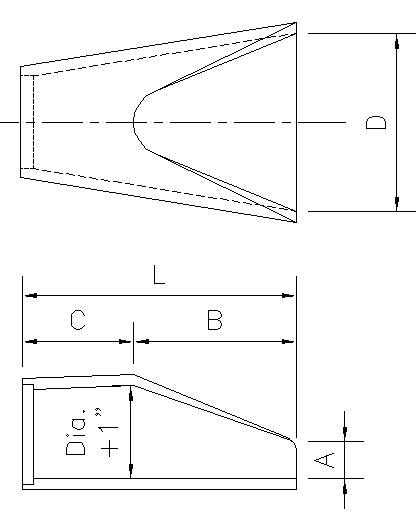
| Pipe Size (in.) | Arch Equiv. | Metric Equivalent (mm) | Weight (lbs/sec) | A | B | C | D | L | Wall Thickness |
|---|---|---|---|---|---|---|---|---|---|
| 15 | 18x11 | 375 | 1,000 | 6" | 27" | 46" | 32" | 73" | 2.250" |
| 18 | 22x13 | 450 | 1,180 | 9" | 27" | 46" | 36" | 73" | 2.500" |
| 24 | 29x18 | 600 | 1,666 | 10" | 44" | 30" | 48" | 74" | 3.000" |
| 30 | 36x23 | 750 | 1,960 | 12" | 54" | 20" | 60" | 74" | 3.500" |
| 36 | 44x27 | 900 | 4,430 | 15" | 63" | 35" | 72" | 98" | 4.750" |
| 42 | 51x31 | 1,050 | 5,630 | 21" | 63" | 35" | 78" | 98" | 5.250" |
| 48 | 58x36 | 1,200 | 6,870 | 24" | 72" | 26" | 84" | 98" | 5.750" |
| 54 | 65x40 | 1,350 | 8,320 | 28" | 78" | 22" | 90" | 100" | 6.250" |
| 60 | 73x45 | 1,500 | 10,660 | 40" | 78" | 22" | 96" | 100" | 6.750" |
| 72 | 88x54 | 1,800 | 14,820 | 46" | 78" | 22" | 102" | 100" | 7.000" |
| Pipe Size (in.) | Round Equiv. | Metric Equivalent (mm) | Weight (lbs/sec) | A | B | C | D | L | Wall Thickness |
|---|---|---|---|---|---|---|---|---|---|
| 22x13 | 18 | 560x245 | 1,050 | 7" | 27" | 45" | 36" | 72" | 3.125" |
| 29x18 | 24 | 725x460 | 1,580 | 8" | 39" | 33" | 48" | 72" | 3.500" |
| 36x23 | 30 | 920x570 | 2,250 | 10" | 48" | 24" | 60" | 72" | 3.500" |
| 44x27 | 36 | 1110x675 | 3,900 | 10" | 60" | 36" | 72" | 96" | 4.000" |
| 51x31 | 42 | 1300x795 | 5,420 | 15" | 60" | 36" | 78" | 96" | 4.500" |
| 58x36 | 48 | 1485x915 | 6,540 | 21" | 60" | 36" | 84" | 96" | 5.000" |
| 65x40 | 54 | 1650x1015 | 7,640 | 25" | 60" | 36" | 90" | 96" | 5.500" |
| 73x45 | 60 | 1855x1145 | 9,510 | 26" | 75" | 21" | 96" | 96" | 6.000" |
| 88x54 | 72 | 2235x1370 | 14,840 | 35" | 78" | 22" | 120" | 100" | 7.000" |
| Nominal Diameter | Inside Diameter, Average | Outside Diameter, Average | Inner Liner Thickness, Minimum | Minimum Pipe Stiffness @ 5% Deflection | Weight kg./6m (lbs./20 ft.) | Area mm2/mm | "I" cm4/cm | "C" mm |
|---|---|---|---|---|---|---|---|---|
| 100 mm (4") |
104 mm (4.10") |
120 mm (4.78") |
0.5 mm (0.020") |
340 kN/m2 50 psi |
4.08 kg (9.00 lbs) |
1.59 (0.063 in2/in) |
0.010 (0.0006 in4/in) |
3.06 (0.12 in) |
| 150 mm (6") |
152 mm (6.00") |
176 mm (6.92") |
0.5 mm (0.020") |
340 kN/m2 50 psi |
7.71 kg (17.00 lbs) |
2.15 (0.085 in2/in) |
0.035 (0.0021 in4/in) |
4.94 (0.19 in) |
| 200 mm (8") |
200 mm (7.90") |
233 mm (9.11") |
0.6 mm (0.024") |
340 kN/m2 50 psi |
13.97 kg (30.80 lbs) |
2.75 (0.108 in2/in) |
0.078 (0.005 in4/in) |
6.36 (0.25 in) |
| 250 mm (10") |
251 mm (9.90") |
287 mm (11.36") |
0.6 mm (0.024") |
340 kN/m2 50 psi |
20.96 kg (46.20 lbs) |
3.48 (0.137 in2/in) |
0.134 (0.008 in4/in) |
7.58 (0.30 in) |
| 300 mm (12") |
308 mm (12.15") |
367 mm (14.45") |
0.9 mm (0.035") |
345 kN/m2 50 psi |
28.96 kg (63.80 lbs) |
5.50 (0.217 in2/in) |
0.574 (0.035 in4/in) |
10.92 (0.43 in) |
| 375 mm (15") |
380 mm (14.98") |
448 mm (17.57") |
1.0 mm (0.039") |
290 kN/m2 42 psi |
42.00 kg (92.50 lbs) |
6.91 (0.272 in2/in) |
0.901 (0.055 in4/in) |
13.21 (0.52 in) |
| 450 mm (18") |
459 mm (18.07") |
536 mm (21.20") |
1.3 mm (0.051") |
275 kN/m2 40 psi |
58.38 kg (128.60 lbs) |
6.93 (0.273 in2/in) |
1.327 (0.081 in4/in) |
14.48 (0.57 in) |
| 600 mm (24") |
612 mm (24.08") |
719 mm (27.80") |
1.5 mm (0.059") |
235 kN/m2 34 psi |
99.93 kg (220.30 lbs) |
8.23 (0.324 in2/in) |
2.245 (0.137 in4/in) |
18.80 (0.74 in) |
| 750 mm (30") |
762 mm (30.00") |
892 mm (35.10") |
1.5 mm (0.059") |
195 kN/m2 28 psi |
145.83 kg (321.50 lbs) |
9.60 (0.378 in2/in) |
4.539 (0.277 in4/in) |
21.84 (0.86 in) |
| 900 mm (36") |
914 mm (36.00") |
1059 mm (41.70") |
1.7 mm (0.067") |
150 kN/m2 22 psi |
191.83 kg (422.9 lbs) |
10.19 (0.401 in2/in) |
6.555 (0.400 in4/in) |
25.40 (1.00 in) |
| 1050 mm (42") Type S |
1054 mm (41.40") |
1212 mm (47.70") |
1.8 mm (0.070") |
140 kN/m2 20 psi |
239.77 kg (528.60 lbs) |
11.64 (0.458 in2/in) |
9.373 (0.572 in4/in) |
30.73 (1.21 in) |
| 1050 mm (42") Type D |
1054 mm (41.50") |
1187 mm (46.75") |
1.8 mm (0.070") |
140 kN/m2 20 psi |
269.76 kg (594.70 lbs) |
14.86 (0.585 in2/in) |
9.685 (0.591 in4/in) |
35.31 (1.39 in) |
| 1200 mm (48") Type S |
1209 mm (47.60") |
1361 mm (53.60") |
1.8 mm (0.070") |
125 kN/m2 18 psi |
283.50 kg (625.00 lbs) |
12.58 (0.495 in2/in) |
9.341 (0.570 in4/in) |
29.72 (1.17 in) |
| 1200 mm (48") Type D |
1208 mm (47.55") |
1339 mm (52.70") |
1.8 mm (0.070") |
125 kN/m2 18 psi |
309.72 kg (682.80 lbs) |
14.76 (0.581 in2/in) |
10.090 (0.616 in4/in) |
33.02 (1.30 in) |
| 1500 mm (60") Type S |
1512 mm (59.5") |
1684 mm (66.3") |
1.8 mm (0.070") |
95 kN/m2 14 psi |
439.56 kg (969.00 lbs) |
14.68 (0.578 in2/in) |
14.09 (0.860 in4/in) |
33.66 (1.32 in) |
| 1500 mm (60") Type D |
1514 mm (59.6") |
1664 mm (65.5") |
1.8 mm (0.070") |
95 kN/m2 14 psi |
509.53 kg (1123.30 lbs) |
17.15 (0.675 in2/in) |
13.305 (0.812 in4/in) |
36.32 (1.43 in) |
*********INPUT DATA*********
DESIGN FLOW = 10 CFS
PIPE SLOPE = 0.02 FT/FT
MANNING'S ROUGHNESS COEF. = 0.012
**********PIPE SIZE***********
PIPE DIAMETER = 18 INCHES
****PARTIAL FLOW CONDITION****
DEPTH OF FLOW = 0.86 FT
VELOCITY = 9.6 FPS
****FLOWING FULL CONDITION****
MINIMUM REQURIED SLOPE = 0.0078 FT/FT
FLOWING FULL VELOCITY = 5.66 FPS
This form helps determine the normal depth of water in a trapezoidal channel.
Q = A * 1.486/n * R2/3 * S1/2
R = A / P
A = B * D + [(Z1+Z2)/2] * D2
P = B + [(Z1*D)2 + D2]1/2 + [(Z2*D)2 + D2]1/2
| Material | Manning's n |
|---|---|
| Metals | |
| Brass | 0.011 |
| Cast Iron | 0.013 |
| Smooth Steel | 0.012 |
| Corrugated Metal | 0.022 |
| Non-Metals | |
| Glass | 0.010 |
| Clay Tile | 0.014 |
| Brickwork | 0.015 |
| Asphalt | 0.016 |
| Masonry | 0.025 |
| Finished Concrete | 0.012 |
| Unfinished Concrete | 0.014 |
| Gravel | 0.029 |
| Earth | 0.025 |
| Planed Wood | 0.012 |
| Unplaned Wood | 0.013 |
| Corrugated Polyethylene (PE) with smooth inner walls | 0.009-0.015 |
| Corrugated Polyethylene (PE) with corrugated inner walls | 0.018-0.025 |
| Polyvinyl Chloride (PVC) with smooth inner walls | 0.009-0.011 |
| Excavated Earth Channels | |
| Clean | 0.022 |
| Gravelly | 0.025 |
| Weedy | 0.030 |
| Stony, Cobbles | 0.035 |
| Natural Streams | |
| Clean and Straight | 0.030 |
| Major Rivers | 0.035 |
| Sluggish with Deep Pools | 0.040 |
| Floodplains | |
| Pasture, Farmland | 0.035 |
| Light Brush | 0.050 |
| Heavy Brush | 0.075 |
| Trees | 0.15 |
Q = A *1.486/n * R2/3 * S1/2
R = A / P
| Material | Manning's n |
|---|---|
| Metals | |
| Brass | 0.011 |
| Cast Iron | 0.013 |
| Smooth Steel | 0.012 |
| Corrugated Metal | 0.022 |
| Non-Metals | |
| Glass | 0.010 |
| Clay Tile | 0.014 |
| Brickwork | 0.015 |
| Asphalt | 0.016 |
| Masonry | 0.025 |
| Finished Concrete | 0.012 |
| Unfinished Concrete | 0.014 |
| Gravel | 0.029 |
| Earth | 0.025 |
| Planed Wood | 0.012 |
| Unplaned Wood | 0.013 |
| Corrugated Polyethylene (PE) with smooth inner walls | 0.009-0.015 |
| Corrugated Polyethylene (PE) with corrugated inner walls | 0.018-0.025 |
| Polyvinyl Chloride (PVC) with smooth inner walls | 0.009-0.011 |
| Excavated Earth Channels | |
| Clean | 0.022 |
| Gravelly | 0.025 |
| Weedy | 0.030 |
| Stony, Cobbles | 0.035 tr |
| Natural Streams | |
| Clean and Straight | 0.030 |
| Major Rivers | 0.035 |
| Sluggish with Deep Pools | 0.040 |
| Floodplains | |
| Pasture, Farmland | 0.035 |
| Light Brush | 0.050 |
| Heavy Brush | 0.075 |
| Trees | 0.15 |
| Mountainous | Hilly Land | Rolling Land | Flat Land | ||||
|---|---|---|---|---|---|---|---|
| C = | 1.00 | 0.80 | 0.60 | 0.50 | 0.40 | 0.30 | 0.20 |
| Pipe Size | Pipe Area |
|---|
Description Cd Cc Cv sharp-edged 0.62 0.63 0.98 round-edged 0.98 1.00 0.98 short tube (fluid seperates from walls 0.61 1.00 0.61 short tube (no seperation) 0.82 1.00 0.82 short tube with rounded entrance 0.97 0.99 0.98 reentrant tube, length is less than one-half of pipe diameter 0.54 0.55 0.99 reentrant tube, length 2 to 3 pipe diameters 0.72 1.00 0.72 smooth, well tapered nozzle 0.98 0.99 0.99
Nominal
 Pipe  O.D.   Average  Min.   Nominal   Max.
 Size          I.D.    Wall   Wt./Ft.   W.P.
 (in)                                   PSI
1/8    .405    .261    .068    .045     810
1/4    .540    .354    .088    .081     780
3/8    .675    .483    .091    .109     620
1/2    .840    .608    .109    .161     600
3/4   1.050    .810    .113    .214     480
1     1.315   1.033    .133    .315     450
1-1/4 1.660   1.364    .140    .426     370
1-1/2 1.900   1.592    .145    .509     330
2     2.375   2.049    .154    .682     280
2-1/2 2.875   2.445    .203   1.076     300
3     3.500   3.042    .216   1.409     260
3-1/2 4.000   3.520    .226   1.697     240
4     4.500   3.998    .237   2.006     220
5     5.563   5.017    .258   2.726     190
6     6.625   6.031    .280   3.535     180
8     8.625   7.943    .322   5.305     160
10   10.750   9.976    .365   7.532     140
12   12.750  11.890    .406   9.949     130
14   14.000  13.072    .437  11.810     130
16   16.000  14.940    .500  15.416     130
18   18.000  16.809    .562  20.112     130
20   20.000  18.743    .593  23.624     120
24   24.000  22.544    .687  32.873     120
Nominal
 Pipe  O.D.   Average  Min.   Nominal   Max.
 Size          I.D.    Wall   Wt./Ft.   W.P.
 (in)                                   PSI
1/8   .405     .203   .095     .058    1230
1/4   .540     .288   .119     .100    1130
3/8   .675     .407   .126     .138     920
1/2   .840     .528   .147     .202     850
3/4   1.050    .724   .154     .273     690
1     1.315    .935   .179     .402     630
1-1/4 1.660   1.256   .191     .554     520
1-1/2 1.900   1.476   .200     .673     470
2     2.375   1.913   .218     .932     400
2-1/2 2.875   2.289   .276    1.419     420
3     3.500   2.864   .300    1.903     370
3-1/2 4.000   3.326   .318    2.322     350
4     4.500   3.786   .337    2.782     320
5     5.563   4.767   .375    3.867     290
6     6.625   5.709   .432    5.313     280
8     8.625   7.565   .500    8.058     250
10   10.750   9.492   .593   11.956     230
12   12.750  11.294   .687   16.437     230
14   14.000  12.410   .750   19.790     220
16   16.000  14.214   .843   25.430     220
18   18.000  16.014   .937   31.830     220
20   20.000  17.814  1.031   40.091     220
24   24.000  21.418  1.218   56.882     210
Nominal
 Pipe  O.D.   Average  Min.   Nominal   Max.
 Size          I.D.    Wall   Wt./Ft.   W.P.
 (in)                                   PSI
1/2    .840    .480    .170    .223    1010
3/4   1.050    .690    .170    .295     770
1     1.315    .891    .200    .440     720
1-1/4 1.660   1.204    .215    .614     600
1-1/2 1.900   1.423    .225    .744     540
2     2.375   1.845    .250   1.052     470
2-1/2 2.875   2.239    .300   1.529     470
3     3.500   2.758    .350   2.184     440
4     4.500   3.572    .437   3.516     430
6     6.625   5.434    .562   6.759     370
Nominal
 Pipe  O.D.   Average  Min.   Nominal
 Size          I.D.    Wall   Wt./Ft.
 (in)
3/4   1.050     .910   .060    .129
1     1.315    1.169   .063    .170

1-1/4 1.660    1.482   .079    .263
1-1/2 1.900    1.700   .090    .339
2     2.375    2.129   .113    .521
2-1/2 2.875    2.581   .137    .754
3     3.500    3.146   .167   1.106
3-1/2 4.000    3.596   .190   1.443
4     4.500    4.046   .214   1.825
5     5.563    5.001   .265   2.792
6     6.625    5.955   .316   3.964
8     8.625    7.755   .410   6.679
Nominal
 Pipe  O.D.   Average  Min.   Nominal
 Size          I.D.    Wall   Wt./Ft.
 (in)
1     1.315    1.175   .060     .164
1-1/4 1.660    1.512   .064     .221
1-1/2 1.900    1.734   .073     .284
2     2.375    2.173   .091     .432
2-1/2 2.875    2.635   .110     .622
3     3.500    3.210   .135     .915
3-1/2 4.000    3.672   .154    1.183
4     4.500    4.134   .173    1.494
5     5.563    5.109   .214    2.288
6     6.625    6.085   .255    3.228
8     8.625    7.921   .332    5.468
10   10.750    9.874   .413    8.492
12   12.750   11.710   .490   11.956
14   14.000   12.860   .538   14.430
16   16.000   14.696   .615   18.810
18   18.000   16.534   .692   23.860
20   20.000   18.370   .769   29.470
24   24.000   22.043   .923   42.520
Nominal
 Pipe  O.D.   Average  Min.   Nominal
 Size          I.D.    Wall   Wt./Ft.
 (in)
18   18.000   17.070   .439   15.370
20   20.000   18.970   .488   18.920
24   24.000   22.748   .585   27.320
Physical Properties of
PVC Pipe                         Value         Test Method

 GENERAL
Cell Classification              12454         ASTM D1784
Maximum Service Temperature      140°F
Color                         white, dark gray
Water Absorption % increase
   24hrs @ 25°C                    .05         ASTM D570
Hardness, Rockwell              110-120        ASTM D785
Poisson's Ratio @ 73°F            .410
Hazen-Williams Factor            C=150
Physical Properties of
PVC Pipe                         Value         Test Method

 MECHANICAL
Specific Gravity (g/cu,cm)      1.40 ± .02     ASTM D792
Tensile Strength, psi @ 73°F      7,450        ASTM D638
Modulus of Elasticity,
   psi @ 73°F (Tensile Modulus)   420,000      ASTM D638
Flexural Strength, psi @ 73°F      14,450      ASTM D790
Compressive Strength, psi @ 73°F    9,600      ASTM D695
Izod Impact, ft-lb./in. @ 73°F      .75        ASTM D256
Physical Properties of
PVC Pipe                         Value         Test Method

 THERMAL
Coefficient of Linear
   Expansion (in/in/°F)         2.9 x 10^-5    ASTM D696
Coefficient of Thermal
   Conductivity
   (BTU/in/hr/ft/°F)                3.5        ASTM C177
Heat Distortion Temperature,
   °F @ 264 psi                     170        ASTM D648
Specific Heat, Cal/°C/gm            .25        ASTM D2766
Physical Properties of
PVC Pipe                         Value         Test Method

 ELECTRICAL
Dielectric Strength, V/mil         1,413       ASTM D149
Dielectric Constant, 60 Hz, 30°F    3.7        ASTM D150
Volume Resistivity, ohm / cm
   @ 95°C, ohms/cm              1.2 x 10^12    ASTM D257
Harvel PVC Pipe is non-electrolytic
Physical Properties of
PVC Pipe                         Value         Test Method

 FLAMMABILITY
Flammability Rating                 V-0        UL 94
Flame Spread Index                  <10        ASTM E162
Flame Spread                     0-25 10-25    ULC ASTM E84
Flash Ignition Temp                 730°F
Average Time of Burning (sec.)      <5         ASTM D635
Average Extent of Burning (mm)      <10
Burning Rate (in/min)               Self
                                    Extinguishing
Softening Starts, (approx.)         250°F
Material Becomes Viscous            350°F
Material Carbonizes                 425°F
Smoke Generation              80-225 600-1000  ULC ASTM E84
| PIPE COMBINATION (inches) | EQUIVALENT SIZE (inches) |
|---|---|
| 2 - 2½ | 2.97 |
| 2 - 3 | 3.36 |
| 2 - 4 | 4.23 |
| 2 - 6 | 6.12 |
| 2 - 8 | 8.07 |
| 2½ - 3 | 3.61 |
| 2½ - 4 | 4.41 |
| 2½ - 6 | 6.22 |
| 2½ - 8 | 8.13 |
| 3 - 3 | 3.90 |
| 3 - 4 | 4.63 |
| 3 - 6 | 6.34 |
| 3 - 8 | 8.22 |
| 4 - 4 | 5.20 |
| 4 - 6 | 6.71 |
| 4 - 8 | 8.46 |
| 6 - 6 | 7.80 |
| 6 - 8 | 9.25 |
| 6 - 10 | 10.91 |
|
ANSI/AWWA C150/A21.50
Pressure classes are defined as the rated water working pressure of the pipe in psi. The thicknesses shown are adequate for the rated working pressure plus a surge allowance of 100 psi. Calculations result in net thicknesses and are based on a minimum yield strength in tension of 42,000 psi and 2.0 safety factor times the sum of working pressure and 100 psi surge allowance. Thickness can be calculated for rated water working pressure and surges other than the above by use of equation 1 in ANSI/AWWA C150/A21.50.
|
||||||||||||||||||||||||||||||||||||||||||||||||||||||||||||||||||||||||||||||||||||||||||||||||||||||||||||||||||||||||||||||||||||||||
| Qmax/Qave= |
18 + P1/2
4 + P1/2 | P = population in thousands |
| Q = A x |
1.486
n | x R2/3 x S1/2 |
| Pipe Size | Minimum Slope | Houses |
|---|
| Customer Classification | Average Monthly Water Use in ccf |
Average Monthly Water Use in gallons |
|---|---|---|
| Residential | 11 | 8,000 |
| Apartment | 6 | 4,500 |
| Inn | 12 | 9,000 |
| Office Building | 4 | 3,000 |
| Small Commercial | 18 | 13,000 |
| Medium Commercial | 157 | 117,000 |
| Large Commercial | 675 | 505,000 |
| Small Industrial | 21 | 16,000 |
| Medium Industrial | 323 | 242,000 |
| Large Industrial | 2776 | 2,076,000 |
Note: 1 Ccf = 748 Gallons
Information from: www.tampagov.net
| Type of Establishment | Water Used (gpd) | |
|---|---|---|
| Airport (per passenger) | 3-5 | |
| Apartment, multiple family (per resident) | 50 | |
| Bathhouse (per bather) | 10 | |
| Boardinghouse (per boarder) | 50 | |
| Additional kitchen requirements for nonresident boarders | 10 | |
| Camp: | ||
| Construction, semipermanent (per worker) | 50 | |
| Day, no meals served (per camper) | 15 | |
| Luxury (per camper) | 100 - 150 | |
| Resort, day and night, limited plumbing (per camper) | 50 | |
| Tourist, central bath and toilet facilities (per person) | 35 | |
| Cottage, seasonal occupancy (per resident) | 50 | |
| Club: | ||
| Country (per resident member) | 100 | |
| Country (per nonresident member present) | 25 | |
| Factory (gallons per person per shift) | 15 - 35 | |
| Highway rest area (per person) | 5 | |
| Hotel: | ||
| Private baths (2 persons per room) | 50 | |
| No private baths (per person) | 50 | |
| Institution other than hospital (per person) | 75 - 125 | |
| Hospital (per bed) | 250 - 400 | |
| Lawn and Garden (per 1000 sq. ft.) | 600 | |
| Assumes 1-inch per day (typical) | ||
| Laundry, self-serviced (gallons per washing [per customer] | 50 | |
| Livestock Drinking (per animal): | ||
| Beef, yearlings | 20 | |
| Brood Sows, nursing | 6 | |
| Cattle or Steers | 12 | |
| Dairy | 20 | |
| Dry Cows or Heifers | 15 | |
| Goat or Sheep | 2 | |
| Hogs/Swine | 4 | |
| Horse or Mules | 12 | |
| Livestock Facilities | ||
| Dairy Sanitation (milkroom) | 500 | |
| Floor Flushing (per 100 sq. ft.) | 10 | |
| Sanitary Hog Wallow | 100 | |
| Motel: | ||
| Bath, toilet, and kitchen facilities (per bed space) | 50 | |
| Bed and toilet (per bed space) | 40 | |
| Park: | ||
| Overnight, flush toilets (per camper) | 25 | |
| Trailer, individual bath units, no sewer connection (per trailer) | 25 | |
| Trailer, individual baths, connected to sewer (per person) | 50 | |
| Picnic: | ||
| Bathhouses, showers, and flush toilets (per picnicker) | 20 | |
| Toilet facilities only (gallons per picnicker) | 10 | |
| Poultry (per 100 birds): | ||
| Chicken | 5-10 | |
| Ducks | 22 | |
| Turkeys | 10-25 | |
| Restaurant: | ||
| Toilet facilities (per patron) | 7-10 | |
| No toilet facilities (per patron) | 2.5 - 3 | |
| Bar and cocktail lounge (additional quantity per patron) | 2 | |
| School: | ||
| Boarding (per pupil) | 75 - 100 | |
| Day, cafeteria, gymnasiums, and showers (per pupil) | 25 | |
| Day, cafeteria, no gymnasiums or showers (per pupil) | 20 | |
| Day, no cafeteria, gymnasiums or showers (per pupil) | 15 | |
| Service station (per vehicle) | 10 | |
| Store (per toilet room) | 400 | |
| Swimming pool (per swimmer) | ||
| Maintenance (per 100 sq. ft.) | 10 | |
| Theater: | ||
| Drive-in (per car space) | 5 | |
| Movie (per auditorium seat) | 5 | |
| Worker: | ||
| Construction (per person per shift) | 50 | |
| Day (school or offices per person per shift) | 15 | |
Source: Adapted from Design and Construction of Small Water Systems: A Guide for Managers, American Water Works Association, 1984, and Planning for an Individual Water System. American Association for Vocational Instructional Materials, 1982.
b = 9.5 K0(VsH)0.25
T = 0.59 (Vs0.47)H-0.91
D = Degree of Curve, Arc Definition
1° = 1 Degree of Curve
2° = 2 Degrees of Curve
P.C. = Point of Curve
P.T. = Point of Tangent
P.I. = Point of Intersection
I = Intersection Angle, Angle between two tangents
L = Length of Curve, from P.C. to P.T.
T = Tangent Distance
E = External Distance
R = Radius
L.C. = Length of Long Chord
M = Length of Middle Ordinate
c = Length of Sub-Chord
k = Length of Arc for Sub-Chord
d = Angle of Sub-Chord
| R = | L.C. | T = R tan(I/2) = | L.C. | |
| 2 sin(I/2) | 2 cos(I/2) |
| L.C. | = R sin (I/2) | D1° = R = 5,729.58 | D2° = | 5,729.58 | D = | 5,729.58 | |||
| 2 | 2 | R |
M = R [1 - cos(I/2)] = R - R cos(I/2)
| E + R | = sec(I/2) | R - M | = cos(I/2) | |
| R | R |
| c = 2R sin(d/2) | d = | kD | |
| 100 |
| L.C. = 2R sin(I/2) | E = R [sec(I/2) - 1] = R sec(I/2) - R |
| L | = Length of Curve | g2 | = Grade of Forward Tangent | |
| PVC | = Point of Vertical Curvature | a | = Parabola Constant | |
| PVI | = Point of Vertical Intersection | y | = Tangent Offset | |
| PVT | = Point of Vertical Tangency | E | = Tangent Offset at PVI | |
| g1 | = Grade of Back Tangent | r | = Rate of Change of Grade |
| y = ax2 | a = | g2 - g1 | ||
| 2 L |
E = a (L/2)2
| r = | g2 - g1 | |
| L |
Tangent Elevation = YPVC + g1x
Grade Elevation = YPVC + g1x + ax2
Parking Lot Layout Dimensions9'-0" stall width (8'-0" for 30° and 0°) | ||||||||
|---|---|---|---|---|---|---|---|---|
| n | S | A | C | U | S' | U' | Spaces per 100ft. of tree | Paved surface per space (sq. ft.) |
| 90° | 19'-0" | 24'-0" | 9'-0" | 62'-0" | 19'-0" | 62'-0" | 11.1 | 279 |
| 60° | 21'-0" | 18'-0" | 10'-5" | 60'-0" | 18'-9" | 55'-6" | 9.6 | 313 |
| 45° | 19'-0" | 13'-0" | 12'-9" | 52'-8" | 16'-7" | 46'-2" | 7.8 | 338 |
| 30° | 16'-6" | 11'-0" | 16'-0" | 44'-0" | 13'-1" | 37'-2" | 6.3 | 349 |
| 0° | 8'-0" | 12'-0" | 23'-0" | 28'-0" | 9'-0" | 30'-0" | 4.3 | 326 |
ADA Accessible Parking Space Requirements | |||
|---|---|---|---|
| Total number of parking spaces provided | Total minimum number of accessible parking spaces (5-foot and 8-foot aisles) | Total van accessible parking spaces with min. 8-foot access aisle | Total additional accessible parking spaces with min. 5-foot access aisle |
| 1 to 25 | 1 | 1 | 0 |
| 26 to 50 | 2 | 1 | 1 |
| 51 to 75 | 3 | 1 | 2 |
| 76 to 100 | 4 | 1 | 3 |
| 101 to 150 | 5 | 1 | 4 |
| 151 to 200 | 6 | 1 | 5 |
| 201 to 300 | 7 | 1 | 6 |
| 301 to 400 | 8 | 1 | 7 |
| 401 to 500 | 9 | 2 | 7 |
| 501 to 1,000 | 2% of total parking provided | 12.5% of 2nd column | 87.5% of 2nd column |
| 1,001 and over | 20 plus 1% of total parking provided over 1,000 spaces | 12.5% of 2nd column | 87.5% of 2nd column |
Tractor Trailer Parking Space Requirements | ||
|---|---|---|
| Description | Dimension | |
| Parking space length | 50 feet | 15 meters |
| Parking space width | 9 feet | 2.75 meters |
| Outside turning radii | 60 feet | 18 meters |
| Vertical clearance | 14 feet | 4.25 meters |
| Backing and maneuvering area | 50 feet | 15 meters |
| Loading dock width | 10 feet | 3 meters |
| Loading dock height | 4 feet | 1.2 meters |
| Loading dock area | 2x area of truck bed | |
For saturated, submerged soils:
qu = qc + qq + qγ
= cNc + qNq + ½γ'BNγ
. . . for strip foundations
qu = qc + qq + qγ
= cNc + qNq + 0.3γ'BNγ
. . . for circular or square foundations
Soil weight is calculated as q = γ'D, where D is the depth of penetration of the foundation
NOTE: γ' is used only for the portion of the soil that is submerged, otherwise the bulk density γ is used (neither is a dry weight!)
For shallow foundations:
Nq = eπ tanφ tan2(45 + φ/2)
Nγ = (Nq - 1) tan(1.4φ)
Nc = (Nq - 1) cotφφ > 0
Nc = π + 2 = 5.14φ = 0, clay
qa = qu / FS
Cohesionless soil (80% or more sand), c = 0, φ from table:
| Soil Type | φ (degrees) |
|---|---|
| Loose sand | 27-35 |
| Medium sand | 30-40 |
| Dense sand | 35-45 |
| Gravel with some sand | 34-48 |
| Silt | 26-35 |
Cohesive soil, assume φ = 0, c from table:
| Consistency | psf | kN/m2 |
|---|---|---|
| Very soft | 0 - 500 | 0 - 48 |
| Soft | 500 - 1,000 | 48 - 96 |
| Medium | 1,000 - 2,000 | 96 - 192 |
| Stiff | 2,000 - 4,000 | 192 - 384 |
| Very stiff | 4,000 - 8,000 | 384 - 766 |
| hard | > 8,000 | > 766 |
N is the average blows per foot in the stratum, number of blows of a 140-pound hammer falling 30 inches to drive a standard sampler (1.42" I. D., 2.00" O. D.) one foot. The sampler is driven 18 inches and blows counted the last 12 inches.
| Sand | Clay | |||
|---|---|---|---|---|
| Density | N | N | Undrained Compressive strength (psf) | |
| Very loose | 0-4 | <2 | <500 | Very soft |
| Loose | 4-10 | 2-4 | 500-1,000 | Soft |
| Medium | 10-30 | 4-8 | 1,000-2,000 | Medium |
| Dense | 30-50 | 8-15 | 2,000-4,000 | Stiff |
| Very dense | >50 | 15-30 | 4,000-8,000 | Very stiff |
| >30 | >8,000 | Hard | ||
| Description | Very Loose | Loose | Medium | Dense | Very Dense |
|---|---|---|---|---|---|
| Standard penetration resistance corr'd, N'* | 0 | 4 | 10 | 30 | 50 |
| Approx. angle of internal friction, (φ)degrees** | 25 – 30 | 27 – 32 | 30 – 35 | 35 – 40 | 38 – 43 |
| Approx. range of moist unit weight, (γ)pcf** | 70 – 100 | 90 – 115 | 110 – 130 | 120 – 140 | 130 – 150 |
* N' is SPT value corrected for overburden pressure.
** Use larger values for granular material with 5% or less fine sand and silt.
(Rather unreliable, use only for preliminary estimate purposes).
| Consistency | Very Soft | Soft | Medium | Stiff | Very Stiff | Hard |
|---|---|---|---|---|---|---|
| qu, ksf | 0 | 0.5 | 1.0 | 2.0 | 4.0 | 8.0 |
| Field standard penetration Resistance, N | 0 | 2 | 4 | 8 | 16 | 32 |
| γ(moist) pcf | 100 – 120 | 110 – 130 | 120 – 140 | |||
NOTE: The reliability of SPT values to determine shear strength of cohesive soils is poor. The SPT values in cohesive soils should not be used for determination of shear strengths for final design.
|
Current mesh name
(wire size) |
Former mesh name
(wire gauge) |
Metric name |
Approximate Weight
(lbs/100 sq. ft) |
|---|---|---|---|
| 2x2 W4.0/4.0 | 2x2 - 4/4 | 50x50 MW25.8/25.8 | |
| 2x2 W2.9/2.9 | 2x2 - 6/6 | 50x50 MW18.7/18.7 | |
| 2x2 W2.1/2.1 | 2x2 - 8/8 | 50x50 MW13.3/13.3 | |
| 2x2 W1.4/1.4 | 2x2 - 10/10 | 50x50 MW9.1/9.1 | |
| 2x2 W0.9/0.9 | 2x2 - 12/12 | 50x50 MW5.6/5.6 | |
| 2x2 W0.5/0.5 | 2x2 - 14/14 | 50x50 MW3.2/3.2 | |
| 2x2 W0.3/0.3 | 2x2 - 16/16 | 50x50 MW2.0/2.0 | |
| 3x3 W2.1/2.1 | 3x3 - 8/8 | 76x76 MW13.3/13.3 | |
| 3x3 W1.4/1.4 | 3x3 - 10/10 | 76x76 MW9.1/9.1 | |
| 3x3 W0.9/0.9 | 3x3 - 12/12 | 76x76 MW5.6/5.6 | |
| 3x3 W0.5/0.5 | 3x3 - 14/14 | 76x76 MW3.2/3.2 | |
| 4x4 W4.0/4.0 | 4x4 -4/4 | 102x102 MW25.8/25.8 | 86 |
| 4x4 W2.9/2.9 | 4x4 - 6/6 | 102x102 MW18.7/18.7 | 62 |
| 4x4 W2.1/2.1 | 4x4 - 8/8 | 102x102 MW13.3/13.3 | 43 |
| 4x4 W1.7/1.7 | 4x4 - 9/9 | 102x102 MW11.1/11.1 | |
| 4x4 W1.4/1.4 | 4x4 - 10/10 | 102x102 MW9.1/9.1 | 31 |
| 4x4 W0.9/0.9 | 4x4 - 12/12 | 102x102 MW5.6/5.6 | |
| 4x4 W0.7/0.7 | 4x4 - 13/13 | 102x102 MW4.2/4.2 | |
| 4x4 W0.5/0.5 | 4x4 - 14/14 | 102x102 MW3.2/3.2 | |
| 6x6 W7.4/7.4 | 6x6 - 0/0 | 152x152 MW47.6/47.6 | |
| 6x6 W6.3/6.3 | 6x6 - 1/1 | 152x152 MW40.6/40.6 | |
| 6x6 W5.4/5.4 | 6x6 - 2/2 | 152x152 MW34.9/34.9 | |
| 6x6 W4.7/4.7 | 6x6 - 3/3 | 152x152 MW30.1/30.1 | |
| 6x6 W4.0/4.0 | 6x6 - 4/4 | 152x152 MW25.8/25.8 | 58 |
| 6x6 W4.0/2.9 | 6x6 - 4/6 | 152x152 MW25.8/18.7 | |
| 6x6 W3.4/3.4 | 6x6 - 5/5 | 152x152 MW21.7/21.7 | |
| 6x6 W2.9/2.9 | 6x6 - 6/6 | 152x152 MW18.7/18.7 | 42 |
| 6x6 W2.5/2.5 | 6x6 - 7/7 | 152x152 MW15.9/15.9 | |
| 6x6 W2.1/2.1 | 6x6 - 8/8 | 152x152 MW13.3/13.3 | 29 |
| 6x6 W1.7/1.7 | 6x6 - 9/9 | 152x152 MW11.1/11.1 | |
| 6x6 W1.4/1.4 | 6x6 - 10/10 | 152x152 MW9.1/9.1 | 21 |
| 12x12 W5.4/5.4 | 12x12 - 2/2 | 305x305 MW34.9/34.9 | |
ASTM Standard Reinforcing Bars |
|||
|---|---|---|---|
|
Bar Size
Designation |
Weight
(Pounds per Foot) |
Nominal Dimensions | |
| Diameter (Inches) |
Cross-sectional
Area (Sq. Inches) |
||
| #3 | 0.376 | 0.375 | 0.11 |
| #4 | 0.668 | 0.500 | 0.20 |
| #5 | 1.043 | 0.625 | 0.31 |
| #6 | 1.502 | 0.750 | 0.44 |
| #7 | 2.044 | 0.875 | 0.60 |
| #8 | 2.670 | 1.000 | 0.79 |
| #9 | 3.400 | 1.128 | 1.00 |
| #10 | 4.303 | 1.270 | 1.27 |
| #11 | 5.313 | 1.410 | 1.56 |
| #14 | 7.650 | 1.693 | 2.25 |
| #18 | 13.60 | 2.257 | 4.00 |
Inches of Lap Corresponding
|
|||||||||
|---|---|---|---|---|---|---|---|---|---|
| Number of Diameters | Size of Bar | ||||||||
| #3 | #4 | #5 | #6 | #7 | #8 | #9 | #10 | #11 | |
| 20 | --- | --- | 13 | 15 | 18 | 20 | 23 | 26 | 29 |
| 22 | --- | --- | 14 | 17 | 20 | 22 | 25 | 28 | 32 |
| 24 | --- | 12 | 15 | 18 | 21 | 24 | 28 | 31 | 34 |
| 30 | 12 | 15 | 19 | 23 | 27 | 30 | 34 | 39 | 43 |
| 32 | 12 | 16 | 20 | 24 | 28 | 32 | 37 | 41 | 46 |
| 36 | 14 | 18 | 23 | 27 | 32 | 36 | 41 | 46 | 51 |
| 40 | 15 | 20 | 25 | 30 | 35 | 40 | 46 | 51 | 57 |
| 48 | 18 | 24 | 30 | 36 | 42 | 48 | 55 | 61 | 68 |
| Minimum Lap equals 12 inches | * Figured to next larger whole inch | ||||||||